
Page 32 - CMA Journal (Sep-Oct 2025)
P. 32
Focus Section
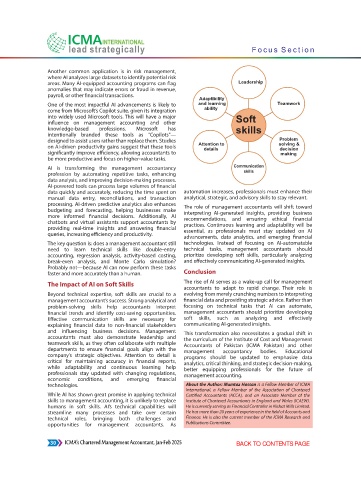
Chart 2. Tariff Increase and Financial Loss (addition to CD)
Financial Loss due to T&D Target Breach (PKR Billion) Financial Loss due to Less Recoveries (PKR Billion)
Average sale Tariff (PKR/kWh)
700 50.00
44.01
45.00
600
40.00
Financial Losses (PKR Billion) 400 15.04 236.3 30.00 Average Tariff for DISCOs (PKR/kWh)
500
35.00
380.8
25.00
300
20.00
200
10.00
158.9 169.6 281.6 15.00
171.6
100 39.4 166.4
122.6 5.00
37.9 58.8 71
0 0.00
FY2019 FY2020 FY2021 FY2022 FY2023 FY2024
Source: NEPRA Reports
The Debt Service Surcharge (DSS) in electricity bills will Non-Cost-reflective Tariff
cover these repayments, ensuring no immediate extra
costs for consumers. The current tariff methodology is complex, with many
layers of charging and adjustments. It involves averaging
However, the plan does not address the main issues costs across the entire value chain to determine total
causing CD, such as poor tariff design and inefficiencies revenue for the utility, including fuel, operations, capacity
in the power supply chain (Malik, 2025; Ali, 2025). Pakistan charges (payments for contracted capacity regardless of
has informed the IMF that the power sector will lose dispatch), and financial charges arising from system
Rs. 535 billion this fiscal year, 35% more than last year, losses. This average price does not accurately reflect the
due to system inefficiencies, while resisting a strict CD actual expenses incurred for different customer groups.
reduction plan (Rana, 2025). Consequently, it can be discriminatory, for example,
Consumer-end tariffs exhibit a high degree of sensitivity against industrial consumers who end up paying charges
to losses within the transmission and distribution they do not contribute to (Malik et al., 2023).
systems. Rising prices weaken consumers' ability to pay, The current tariff system relies on cross-subsidies.
fueling poverty, theft, and payment delays that add to Domestic users, who account for 89% of total consumers,
arrears. The recent surge in PV and BESS adoption further are subsidized at the expense of productive sectors,
worsens this dynamic, as more consumers move off-grid, distorting market signals and increasing non-productive
eroding recoveries and intensifying the power sector's energy use. Beyond that, even among domestic
financial strain (Malik & Ali, 2025). consumers, about 86% (61% lifeline and protected, and
For businesses and industries, this may lead to a switch to 25% unprotected in the first two slabs) are cross-
alternatives, which in some cases results in the shutdown subsidized by the remaining 14% of unprotected and
of economic activities and decreased grid demand, TOU consumers.
ultimately increasing capacity payments. It is crucial to The slab-based approach, meant to help lower-
note that tariff design is more critical than the tariff rate income households, often ends up unfairly benefiting
itself. Increasing tariffs alone may exacerbate the issue of higher-income households. A comparison of
CD. Tariff adjustments during peak demand, such as electricity sales in the domestic sector for FY23 and
summer, result in unexpected bill spikes, further FY26 shows an aggregate estimated decrease in sales
increasing challenges for consumers of about 10%.
30 ICMA’s Chartered Management Accountant, Sep-Oct 2025