
Page 33 - CMA Journal (Sep-Oct 2025)
P. 33
Focus Section
The prevailing tariff structure, rooted in a
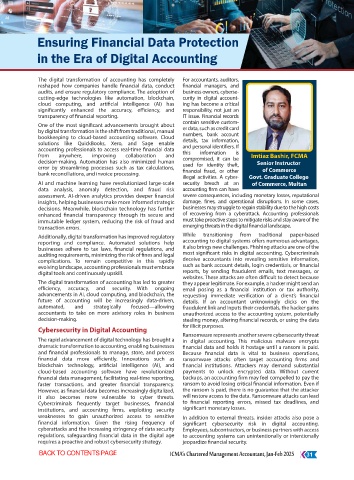
Chart 3: Average Tariff (PKR/kWh) FY26 1960s load suppression model, is outdated
Sectoral Tariff (PKR/kWh) Nationall Average (PKR/kWWh) (Cheema et al., 2022). As of March 2025, the
T
total installed capacity is 46,000 MW, with
about 90% from 'take-or-pay' power plants.
However, more than 50% of this capacity
31.599
remains inactive for four to five months each
45.43 3 43.17 41.76 year, adding to the capacity payment burden.
3 33.48 30.75 32.68
27.2 Currently, capacity purchase costs account for
approximately 50% of consumer electricity
tariffs, excluding taxes. Decision-makers face
S
Domesticc Commercial General Services Industry Bulk Agriculture Others
r
d
two choices: either transfer the burden of
Source: NEPRA Tariff Determination, July 01, 2025 capacity payments to consumers dependent
Table 1: Domestic Sector on the grid, or include it in arrears.
Units Consumed Govt. Notified Tariffs The misalignment between pricing and
(GWh) (PKR/kWh) demand, caused by significant cross-subsidi-
FY23 FY26 FY23 FY26 zation, has shifted electricity consumption
Protected 0-50 634 338 3.95 3.95 towards the subsidized domestic sector,
51-100 253 381 7.74 7.74
001-100 8918 12287 7.74 10.64 projected to account for about 50% of total
101-200 2286 2965 10.06 13.01 usage in FY26, compared to 24% for industry.
Unprotected 001-100 3440 3199 13.48 22.44 This tariff strategy raises concerns, as it under-
101-200 7047 6450 18.58 28.91 mines the industry's competitiveness in the
201-300 12587 10306 21.47 33.1
301-400 7158 4886 24.63 37.99 global market.
401-500 3953 2499 26.09 40.2 Over the years, while there have been some
501-600 2287 1414 27.01 41.62 adjustments to the slab-based approach, the
601-700 1462 858 27.65 42.76
700 or more 3702 2027 31.12 47.69 core tariff design and its inefficiencies have
TOU Peak 519 578 33.23 46.55 persisted, worsening with rising tariffs. In
TOU Off-peak 2358 2630 26.91 40.63 FY14, the system shifted from an all-slab to a
Source: NEPRA Tariff Determinations - July 01, 2025, and July 22, 2022. previous-slab benefit, raising rates for slabs
above 200 kWh and increasing overall tariffs to reduce
However, the number of units sold in the protected subsidies for wealthier households. In FY22, the
(including lifeline) category has increased by about 32%, government redefined the slabs, established a
compared to a decrease of 24% in the unprotected "protected" consumer category, and eliminated the
group. Not all unprotected groups have shifted to TOU previous slab benefit for unprotected residential
(or opted for net-metering), as it increased by only 11%. customers, leading to billing based solely on the current
86% of households in this category are not necessarily slab's rate.
poor or from a lower-middle-income background. In
urban areas, these consumers, typically using 0 to 300 Uniform Tariff Policy
units, often live in congested neighborhoods. This The government enforces a uniform electricity tariff
congestion raises concerns about power theft and across all regions, with any differences funded through a
increased line losses. Additionally, many households tariff differential subsidy (TDS) to Distribution Companies
have two or three meters to divide their load and stay (DISCOs), even if they are privatized. The National
within the lower billing slab. Electricity Policy 2021 supports this approach.
However, all these are old phenomena, which cannot In FY26, Rs. 1.04 trillion is allocated to the power sector,
explain the change in share over the last three years, as with approximately 44% of the allocation going to TDS.
illustrated in the above table. Probably, consumers Energy subsidies have been a significant drain on
opting for rooftop solar, which is behind the meter, are resources, totaling approximately Rs. 8.2 trillion since
the reason behind the increase in units in the FY07, with over 65% of this amount being TDS.
unprotected category.
Uniform national tariffs worsen distortion in the power
The current progressive tariff structure unfairly burdens sector. Efficient DISCOs such as IESCO, GEPCO, and FESCO
compliant consumers without solar options. Applying cross-subsidize loss-making ones like PESCO, SEPCO,
different marginal costs (MCs) for the same product HESCO, and QESCO, undermining efficiency incentives.
complicates economic decisions. Although intended to True tariff reform must therefore go beyond periodic
help low-income populations, it creates a conflict price hikes to address structural inequities. Without this,
between efficiency and equity, leading to deadweight Pakistan's energy system will remain unaffordable,
loss compared to direct cash transfers to those in poverty. unsustainable, and unaccountable.
ICMA’s Chartered Management Accountant, Sep-Oct 2025 31