
Page 39 - CMA Journal (Sep-Oct 2025)
P. 39
Focus Section
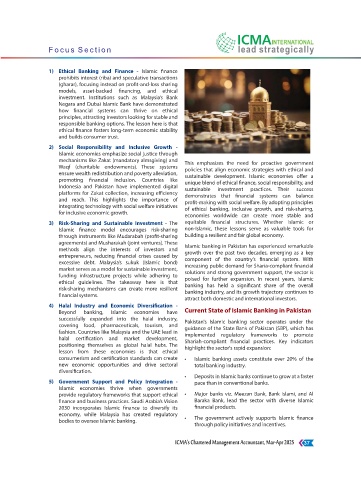
Figure 1: Tariff Structure of Pakistani population are higher than those of most of its
Comparable Economies (2024) competitors in the region. The NTP 2019 policy stated
that the weighted average tariff was much higher
Total Effective Tariff (%) compared to the average of the top 70 countries that
Share of HS Subheadins >15%(%)
export to it. Recently, the Ministry of Commerce in
Pakistan
India Pakistan has proposed NTP 2025–30, which has already
Bangladesh been passed under the federal budget, although the
Nepal
Bhutan Tariff Policy 2025–30 repeats the idea that distortions
Sri Lanka should be minimised and policy space should be
China available to implement strategic interventions.8
Vietnam
Cambodia
Indonesia Where Pakistan stands today: National
Malaysia
ASEAN (Average) Tariff Policy (NTP) 2025–30
South Asia (Average)
Global Average 0% 10% 20% 30% 40% The National Tariff Policy (2025–30) can be interpreted as
Total Effective Tariff (%) an effort to re-establish the balance. There are three main
strategic pillars of the NTP 2025–30 policy that determine
Being a member of the World Trade Organisation (WTO)
the policy objectives.
since 1995, Pakistan has a very protective tariff system.
The simple average bound rate for non-agriculture is • Targets and Growth Objectives: Targets reflect a
60.8% (agriculture: 96.2%, non-agriculture: 55.2%), shift from protectionism toward export-led
compared to the applied MFN average of 10.3%, competitiveness. However, feasibility depends on
suggesting a substantial amount of tariff water between exchange rate stability, logistics reform, and energy
the bound and applied rates. As seen in Figure 1, Pakistan reliability, factors not covered by the policy itself.
has a high total effective tariff (around 18.5), which is an
• Tariff Structure Reforms: Represent a deliberate
indication of its strong protectionist policy, as it combines
simplification and transparency agenda, but the
its base tariff (MFN tariff) with other customs and
pace of rationalisation could pressure revenue and
regulatory charges. Protectionism can be aimed at
provoke resistance from protected sectors (automo-
protecting local industries but this tends to lead to
tive, steel, chemicals). Success hinges on coordina-
increased import prices, shortages in access to
tion between the FBR, MoC, and industry associa-
intermediate goods, and low competitive advantage in
tions.
exports. On the other hand, economies of ASEAN
(Malaysia, Vietnam, Thailand and Indonesia) have low • Expected Macroeconomic and Industrial Outcomes:
tariffs of less than 10, which is an indication of openness The policy’s logic aligns with global best practices,
to trade that encourages foreign investment and makes linking tariff simplification to industrial efficiency,
them part of the global supply chains. Nonetheless, large but the risk of implementation remains high without
upper limits (50-100%) provide enormous discretionary complementary actions in trade facilitation, standards
room, resulting in policy uncertainty and trade infrastructure, and technology upgrading.
distortion.7
Figure 2: NTP’s Strategic Pillars
Table 1. Tariffs and Imports: Summary and Duty Ranges 7
Linking NTP 2025–30 with the
Agricultural Non-Agricultural Protectionism vs. Export Orientation Debate
Category Total
Ag) (Non-Ag
Simple average
final bound 60.8 96.2 55.2
III. EXPECTED
MFN applied (2024) 10.3 13.0 9.9 I. TARGETS & GROWT II. TARIFF-STRUCTURE MACROECONOMIC
OBJECTIVES REFORMS
& INDUSTRIAL OUTCOMES
Trade weighted
• Stimulate export growth • Streamline Customs • Lower input tariffs to
average (2024) 7.3 5.4 7.7 at 10-14% annually. Duty (CD) slabs to 0 %, reduce production costs
• Contain import 5%, 10 %, 15% within and imported inflation,
Imports five years especially in food and
expansion to 5-6 %.
(2023, billion US$) 50.0 9.3 40.7 • Achieve a simple • Phase out Regulatory intermediates.
average tariff of 9.7 % and Additional Customs • Promote investment,
National Tariff Policy: 2019-24 VS 2025-30 by FY 2029-30. Duties (RDs, ACDs) over productivity, employment,
4-5 years
and GVC integration
• Lower trade-weighted
tariffs from 10.6 % • Rationalize 5th Schedule • Correct the existing
The National Tariff Policy (NTP) indicates that the average = below 6% concessions to eliminate cascading tariff structure
tariffs and the range of other duties imposed on the distortions (0-3-11-16-20%) that
discourages diversification
ICMA’s Chartered Management Accountant, Sep-Oct 2025 37